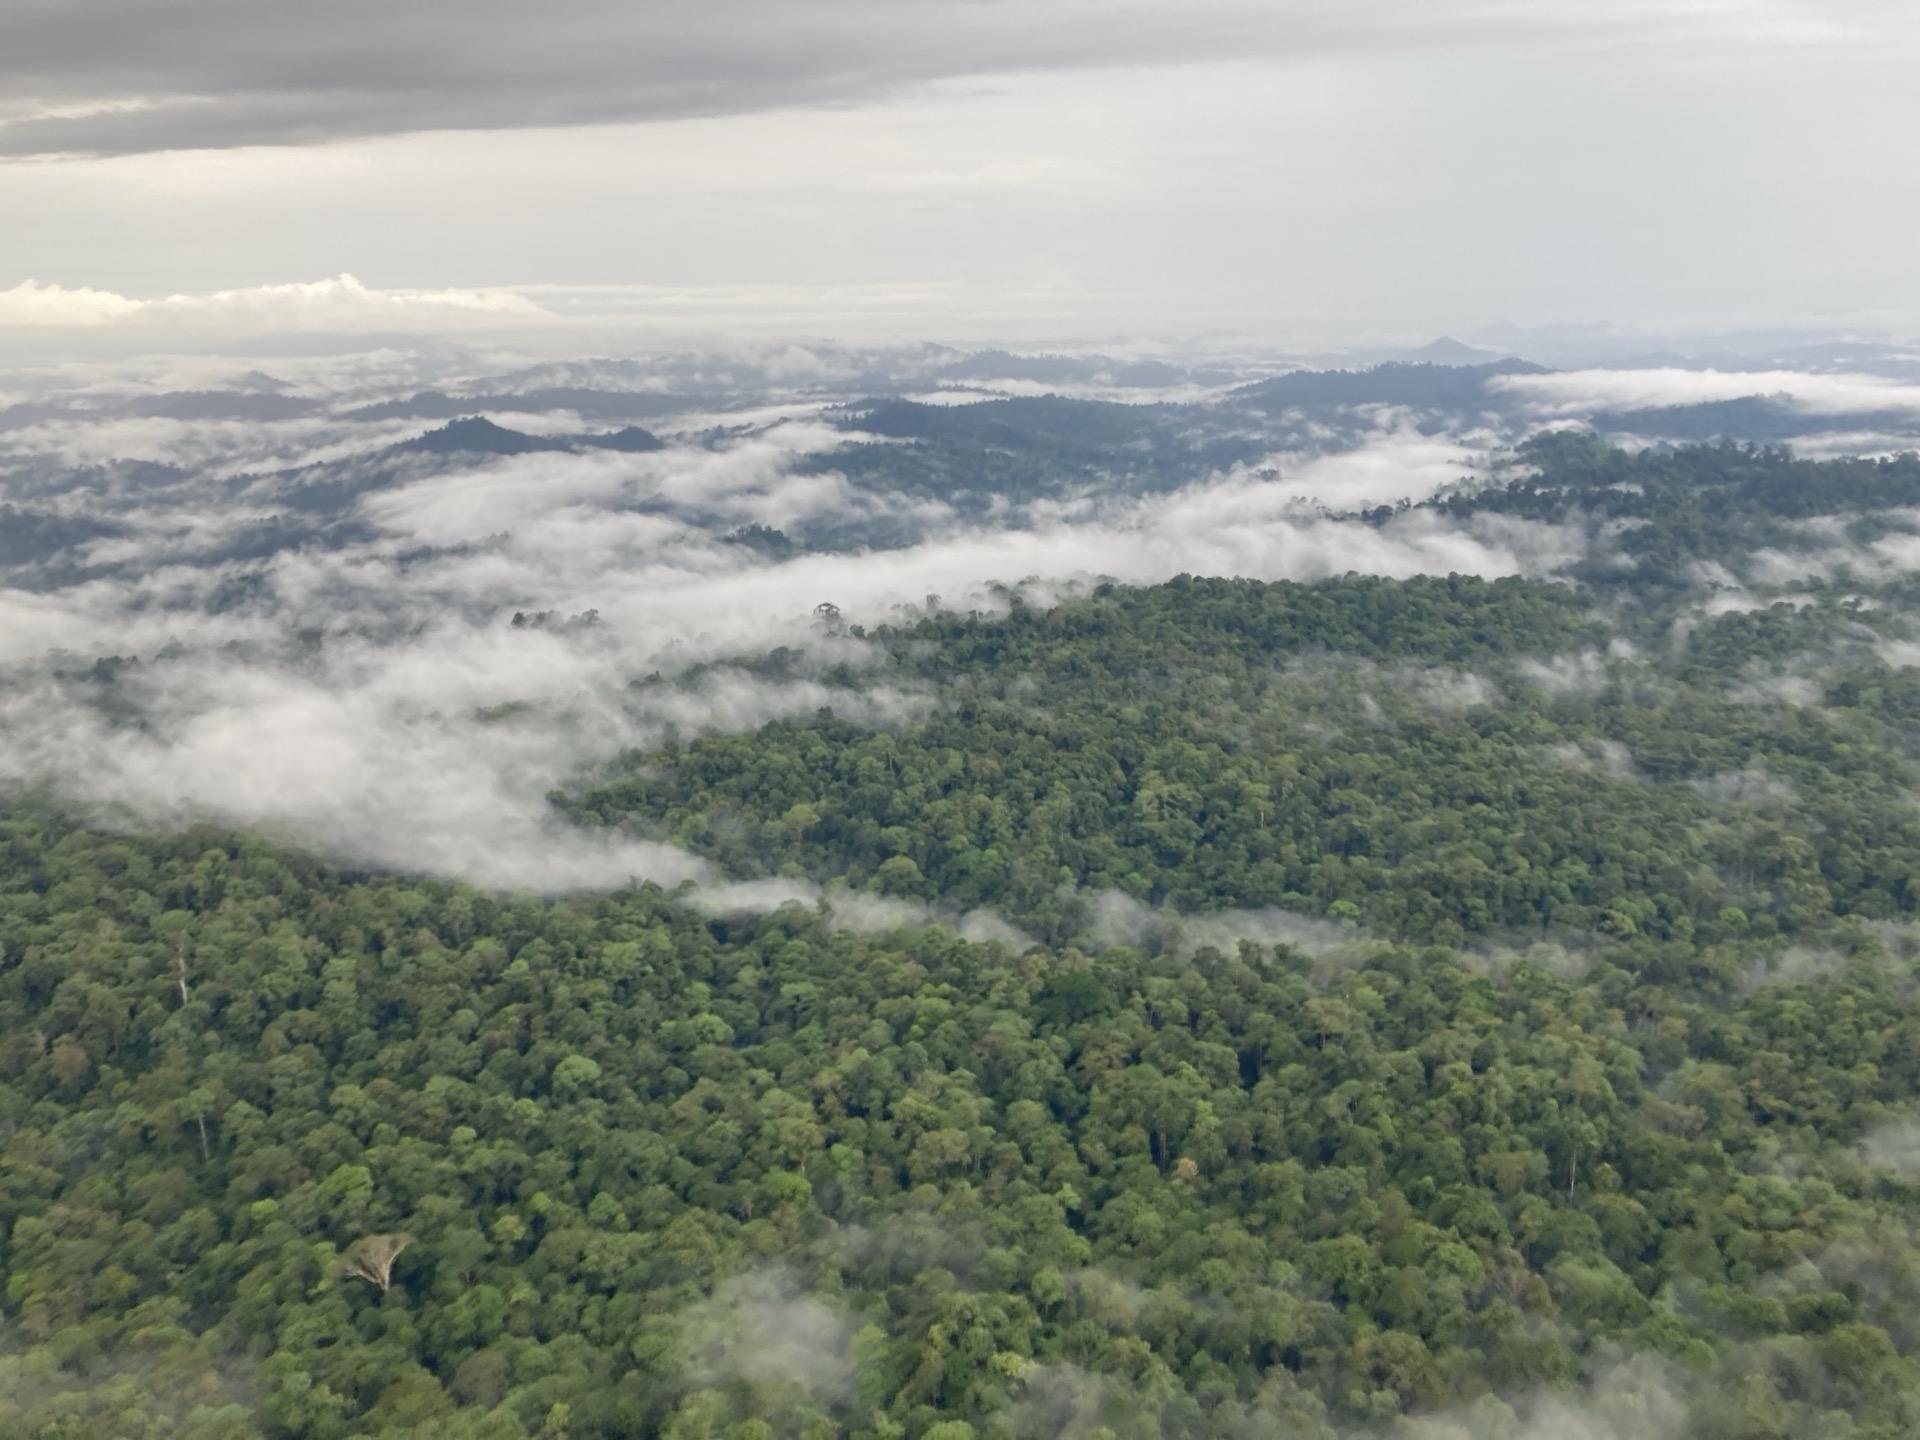
One matching engine, three markets
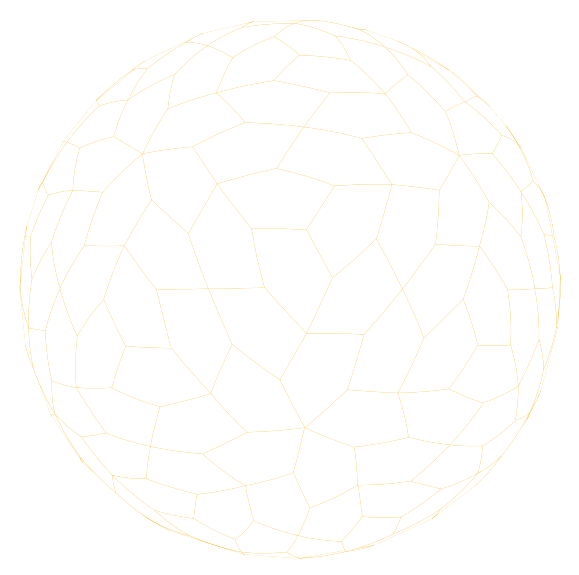
ramet5the matching engine. Finds comparable areas.
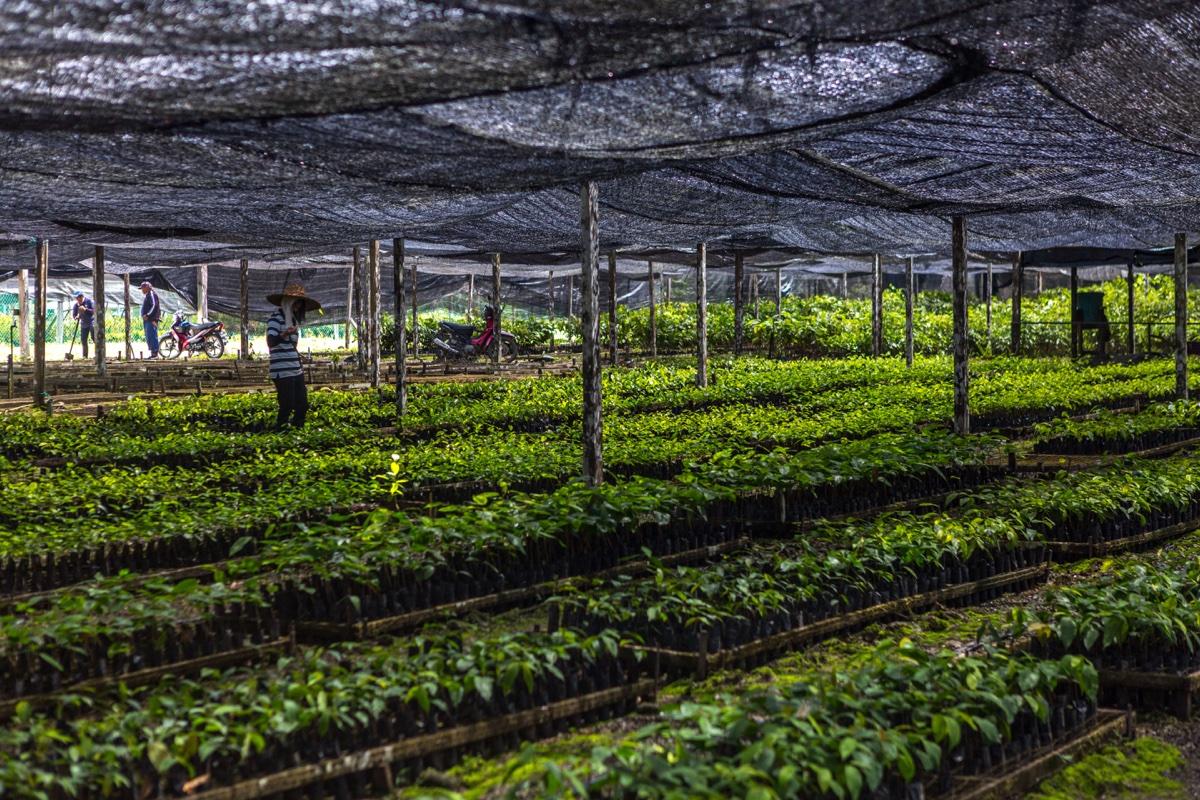
ramet5 answers the same question for each of them: which other places on Earth are comparable to this one? Each market gets a product built on the engine. ramet47 is the first with a name.
How it works, in five steps
We are aiming to be the most transparent data provider in this market, and that is a claim you can test on this site.
A method you cannot examine is a method you should not rely on. That is the standard we work to, and it is what lets a buyer, an auditor or a registry judge our answers for themselves.
We have filed a patent application for our matching method. That is what lets us describe it here in detail instead of hiding behind a proprietary black box.
What we publish. The ramet47 method and the stocking index behind it are written up in a methodology note. Our tools for the A5 grid are open source under the Apache 2 licence: a5R, the R package for the grid, on CRAN; petalcluster, for density clustering; and ctreesR, a reader for CTrees biomass data. The A5 grid itself was created by Felix Palmer.
The satellite fingerprints come from two published foundation models: AlphaEarth Foundations (Brown et al., 2025) and Embedded Seamless Data (ESD, Chen et al., 2026). Both papers are open.
What we hand over. On request from the project proponent, Verra or the auditor, we deliver: the stocking index data with its derivation and validation; the project and control plots with their geometry, weights and stocking index series; and the balance, trend and benchmark statistics, in standard formats on a fixed global grid. For proprietary components our route is controlled access plus documentation, sufficient for validation and verification.
Every product we build runs on the same engine, and it answers that one question. The comparable places become the reference areas, and what happens in them is the evidence for what would have happened in the project.
Each market gets a product built on the engine. ramet47, our product for Verra’s VM0047, is the first with a name. The other two are in development, and parts of them can be bought today: counterfactual monitoring for avoided deforestation, and pilot projects in biodiversity.
For every project we produce three things. Priced per project.
What we estimate would have happened without the project, stated as a range with upper and lower bounds, not a single figure.
The comparable places the estimate rests on, as maps you can open and inspect, with the reasoning for why each one was selected.
Written to be examined by someone who is looking for problems. If our outputs generate findings during validation or verification, we answer them in writing until they are closed.
We price per project, not per hectare of reference area. However many reference areas the analysis needs, they are included. Larger projects cost more than smaller ones.
The first product with all three ready is ramet47, for tree planting and restoration under VM0047. The VM0047 page lists exactly what arrives, item by item.
Baselines are usually reported as a single number. We give a range, because a single number implies a precision that does not exist.
This is also why we are not a ratings agency and do not intend to become one. It is not a rating, it is a benchmark. We publish the mean and the bounds around it, and we leave the judgement to the people whose job it is.
What the range covers. Every stocking index value comes with a range. We check those ranges against lidar measurements that were kept out of the model’s training, and the 95% range contains the true value about 95% of the time. The range is not symmetrical, and it widens where the record shows a sudden change such as clearing. The benchmark has its own range. For every baseline year we test that the project and its reference areas were in balance, and we report the result. Reference areas that sit next to each other are not counted as independent evidence.
What a project sends. The project boundary as a GIS file, the project start date, and the methodology it is using, with its crediting approach and baseline length. Field plots, where the project has them, improve the result but are not essential.
The stages the analysis goes through, for a VM0047 project:
- The boundary is laid on the equal-area grid, and each cell inside it becomes a project plot.
- The candidate comparison land is assembled from the methodology’s own rules (same jurisdiction and ecoregion, matched policy and tenure, within 100 km of the project, minus the project itself, protected areas and registered carbon projects), then narrowed to land that resembles the project in the satellite record.
- The stocking index is built for the project and the candidates, for every year of the baseline and the monitoring period, with its validation.
- Controls are matched to project plots on their stocking index history, and balance is checked for every baseline year. A plot that cannot be balanced is flagged, not quietly credited.
- The benchmark and the baseline with its bounds are calculated.
What comes back. The maps of the candidate pool and the selected reference areas, the matched controls with their weights, the balance statistics, the stocking index with its validation, and the benchmark, through our web platform and the API.
Validation and verification. We deliver the data and documentation in auditable formats within the timelines agreed for listing, validation and verification, and we answer any findings on our outputs in writing until they are closed. At each verification the benchmark is recalculated on new stocking index data, controls that have become invalid are replaced, and Verra is notified of any change to our methods that affects data already provided.
Our approach to counterfactual estimation grew out of published ecological research. We work with the University of Aberdeen, the University of Exeter and ETH Zurich, and our development has been supported by the European Space Agency and by Innosuisse, the Swiss innovation agency.
Our team’s response to West et al., the widely cited assessment of forest carbon projects, set out where we think the existing statistical approaches go wrong, particularly in how the pool of candidate comparison areas is built. The detail of that argument is on the ramet5 page.
We make our own biomass maps, and they come with every baseline at no extra charge. If a biomass map is all you need today, we can supply that too, and it comes with the information you need to judge how far to trust it. What a biomass map cannot do is answer the baseline question: it tells you how much carbon is standing in a forest today, not how much would have been there anyway.
We do not rate projects, score them or rank them. We do, however, put uncertainty estimates on baselines. If that would be useful to you across a portfolio of projects, or a set of potential project areas, get in touch.
We build the science that methodologies run on. The best of the recent ones have moved the field forward, and we build for them first. Think of our work as methods for methodologies: the reference areas, the baselines and the uncertainty that decide whether a methodology works as well on the ground as it does on paper. Where we think a requirement could be better we say so, in public comments and in our published work. And we are already working on the science to support the next generation of methodologies.
Questions people ask
What is a counterfactual baseline?
A counterfactual baseline is an estimate of what land would have looked like without a carbon project. A project’s baseline decides how many credits it can claim, so everything else in a credit depends on getting it right.
Why does belian.earth report a range instead of a single number?
A single number implies a precision the underlying question does not have. belian.earth reports the mean with upper and lower bounds, covering the uncertainty in estimating what would have happened without the project.
Is belian.earth a ratings agency?
No. belian.earth does not rate, score or rank projects. It publishes a benchmark: the estimate and the bounds around it, leaving judgement to buyers, auditors and standards bodies.
What does belian.earth deliver for a project?
Three things: the baseline as a range with upper and lower bounds, the reference areas as inspectable maps with the reasoning for each selection, and audit materials written to be examined critically.
How is a carbon baseline different from a biomass map?
A biomass map measures how much carbon is standing in a forest today. A baseline estimates how much would have been there without the project. belian.earth makes its own biomass maps and includes them with every baseline, and can supply a map on its own, but a map cannot answer the baseline question.
What is ramet5?
ramet5 is belian.earth’s matching engine. It finds the areas of a landscape comparable to a project area, which become the reference areas its baselines are built on. Every belian.earth product runs on it.
Related reading
Where the belian.earth team has written on the questions this page raises.
Why Forest Restoration Projects Need Robust Counterfactual Baselines
by Christopher D. Philipson
Every forest carbon project depends on a counterfactual baseline to demonstrate its impact. Whether avoiding deforestation or restoring degraded land, the underlying question is the same: what would have happened without the intervention?
Read articleOpinionThe carbon baseline problem nobody wants to talk about
by belian.earth
The carbon market has an integrity problem. But while the industry obsesses over which biomass map to trust, the real uncertainty is in the carbon baseline.
Read articleOpinionVM0047's brave call is your ARR project's defining moment
by belian.earth
VM0047 locks the developer's matched reference areas at validation and keeps them fixed for the full crediting period. That single choice defines your ARR project's baseline for decades.
Read articleUnfamiliar with a term? See the glossary.
Stay in the loop
Stay up to date with developments in independent reference area selection and carbon market baselining.